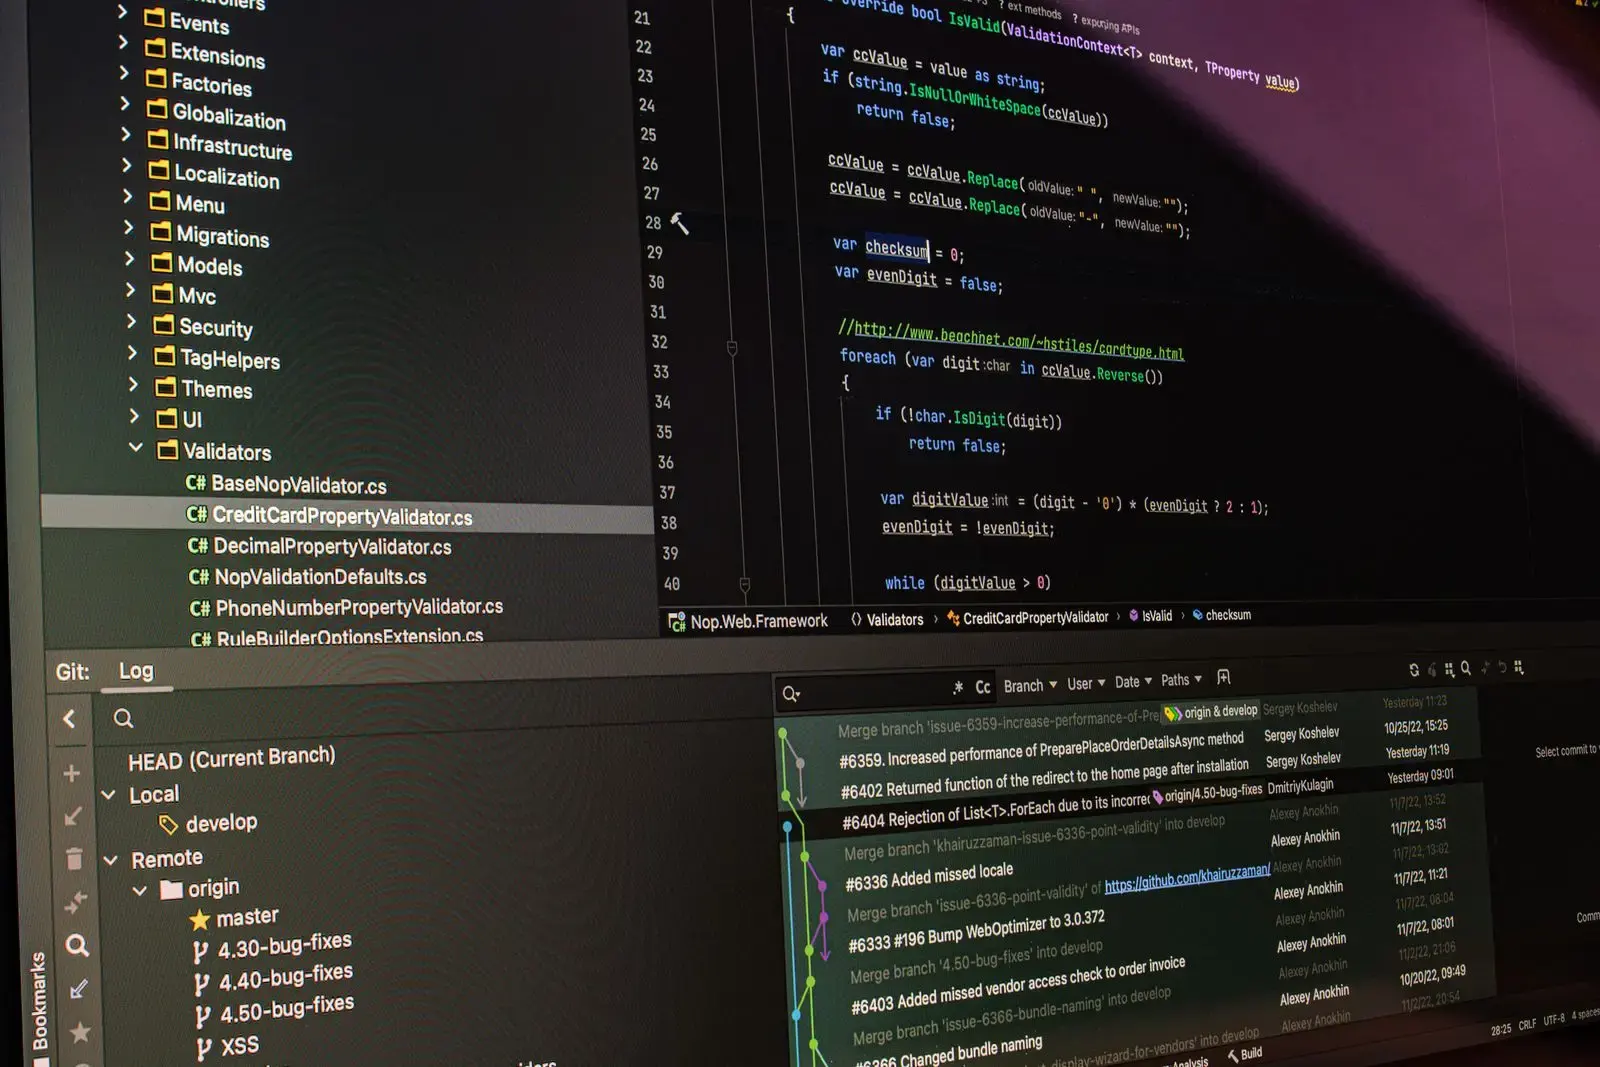
Byte-Code Instrumentation
Data collected by an agent, with no changes to your code.



HomeAPM ServicesCode-Level Diagnostics
Code-Level Diagnostics MAIT · Abu Dhabi since 2014
When a transaction is slow, find the exact method, database query or external call responsible. MAIT sets up code-level diagnostics that trace requests through your Java and .NET applications without changing your source code.
Overview
Infrastructure dashboards can tell you a server is busy, but not which part of your application is making it busy. Code-level diagnostics follow each request through the application, recording the methods it calls, the database queries it runs and the external services it waits for.
For Java and .NET this works through byte-code instrumentation: an agent attached to the application runtime collects the data, so developers do not need to add logging or change code. MAIT installs and configures the agents, chooses the transactions to trace and helps your developers read the results.

What it reveals
Instead of guessing, your developers see where each request spends its time and where it fails.
Follow one request from the web tier through application servers, databases and external services. The map shows each hop and how long it took, so a slow link in the chain is obvious.
Talk to us about thisSee which methods take the most time and which SQL queries run slowly or too often. Developers get the evidence they need to optimise the right piece of code first.
Talk to us about thisCapture exceptions and failed calls along with the transaction they belong to. That makes intermittent errors, the ones nobody can reproduce on demand, far easier to track down.
Talk to us about thisDevelopers and IT pointing at each other?
Our Abu Dhabi team walks you through code-level diagnostics in a free consultation and shares pricing for your applications before any commitment.
Features
We focus tracing on the transactions that matter, so your team gets clear answers rather than a flood of data.
Data collected by an agent, with no changes to your code.
Each request followed across tiers and services.
See which methods take the most time.
Slow and repeated queries linked to the code that runs them.
Time spent waiting on APIs and other services.
Errors recorded with the transaction they broke.
Memory, threads and garbage collection in the JVM and .NET runtime.
Detailed records kept for the requests that went wrong.
Developers & IT
When an application slows down, operations teams often blame the code and developers blame the servers. Without shared evidence, incidents drag on while each side defends its own area.
Code-level diagnostics give both teams the same view of every slow transaction, from the user's request down to the query and back. Fixes are faster, and you can prove they worked by comparing performance before and after the change.
Honest advice
Code-level diagnostics are most useful for Java and .NET applications that you build, customise or host yourself. Something else may suit you better if:
Read before you decide
Ask Which Fits UsHow it happens
You review each stage with us, and your developers stay involved from the first trace.
Start With a DemoWe agree which Java or .NET applications to cover and which business transactions matter most.
We install the agents in a test environment first where possible, check the impact, then roll out to production.
We collect normal traffic so slow transactions stand out against your own baseline.
We go through the first results with your team and show them how to read traces on their own.
We confirm improvements after each release, and our Abu Dhabi team stays on hand for support.
Client feedback
We partnered with MAIT for software development and ongoing support. Their expertise and commitment truly set them apart in the UAE market.
The MAIT team is highly professional and responsive. From consultation to delivery, everything was handled smoothly and on time.
MAIT delivered exactly what we needed. Their MAIT solutions improved our system performance and helped us streamline operations without any disruption.
FAQ
Still not sure? Our Abu Dhabi team gives straight answers.
Code-level diagnostics trace individual requests through your application and record where the time goes: which methods run, which database queries are made and which external services are called. When a transaction is slow or fails, your team can see the exact step responsible instead of guessing.
No. For Java and .NET applications, the data is collected through byte-code instrumentation. An agent is attached to the application runtime and gathers method calls, queries and requests on its own, so your developers do not have to add logging or modify the source code.
MAIT's code-level diagnostics service focuses on Java and .NET applications. If your applications use other technologies, tell us during the consultation and we will confirm what can be covered and suggest other monitoring options where code-level tracing is not available.
The agents are designed to run on live systems. As a precaution, MAIT installs them in a test or staging environment first where possible, checks the impact on your application, and only then rolls them out to production. We also limit detailed tracing to the transactions that matter.
Yes. Distributed transaction tracing follows a request as it moves from the web tier through application servers, databases and external services, and shows a flow map with the time spent at each hop. This is especially helpful for multi-tier and service-based applications.
Both. MAIT reviews the first findings with your team and shows your developers and IT staff how to read traces and dashboards on their own. After that, our Abu Dhabi team remains available when you need help interpreting a difficult issue.
Also from MAIT
Get in touch
Tell us what you are building. There is no commitment until you have our proposal.
MAIT builds custom software, mobile apps, POS systems, and enterprise solutions for businesses across the UAE. Trusted IT partner since 2014.
Get a Free Consultation